

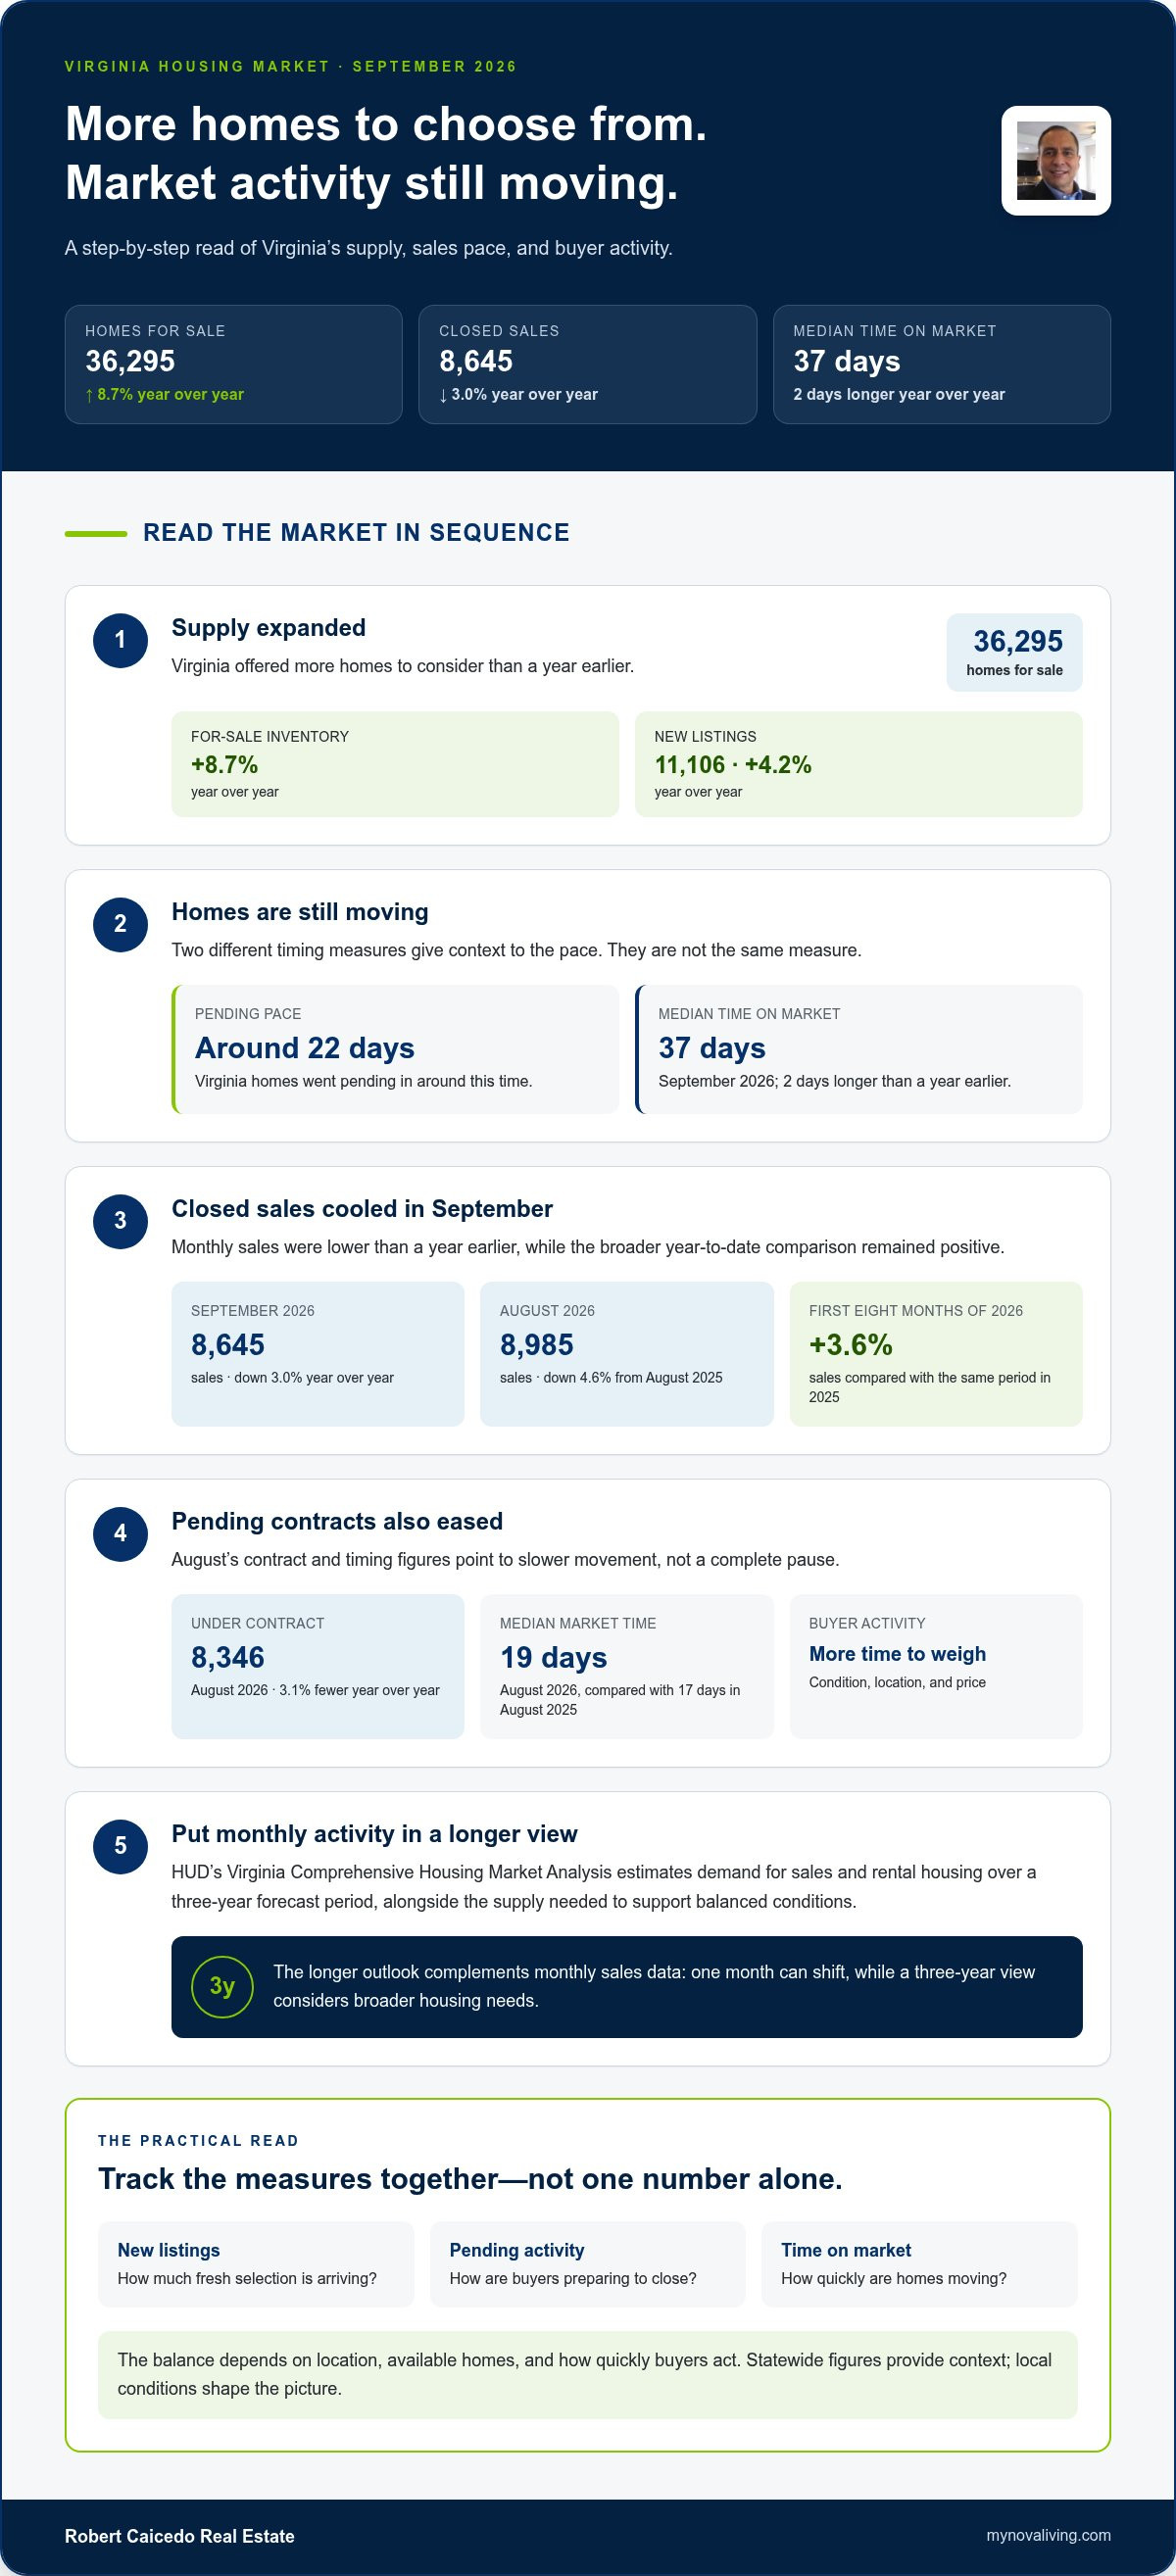
Virginia had 36,295 homes for sale in September 2026, up 8.7% from a year earlier, yet homes went pending in around 22 days. The Virginia housing market forecast points to more choice for buyers, but not a market without competition. Inventory is growing while homes continue to move.
If you’re weighing a move, that mix can feel hard to read. Virginia’s median time on market reached 37 days in September, up 2 days year over year, while 29.0% of homes still sold above list price. More listings may create room to compare, but local conditions matter.
This Virginia housing market forecast looks at what supply, buyer activity, and price trends suggest statewide, then puts Northern Virginia in sharper focus. You’ll see how local differences shape the outlook, why statewide trends don’t tell the whole story, and which factors can inform your next move.
Key Takeaways
- Read sales figures alongside the time homes take to sell. Virginia recorded 8,645 sales in September 2026, down 3.0% year over year, a sign to look beyond price alone when judging demand.
- Use local conditions to refine your outlook. Statewide averages can mask differences in buyer demand, inventory, and price direction from one Virginia market to another.
- Explore HUD’s market analyses for added local context; its Virginia reports assess housing demand over a three-year forecast period.
- If you’re preparing to sell, use market conditions to shape your timing and pricing strategy with Seller Representation from Robert Caicedo Real Estate.
Are there enough homes for sale to meet buyer demand?
The Virginia housing market forecast for 2026 points to expanding supply, but buyer activity remains active. Virginia had 36,295 homes for sale in September 2026, up 8.7% year over year. New listings also rose, reaching 11,106, up 4.2%. That gives buyers more homes to consider than a year earlier. Yet listings alone don't show how quickly suitable homes attract offers.
Speed offers another view of demand. Virginia homes went pending in around 22 days, while the statewide median time on market was 37 days in September 2026. The measures differ, but both show homes continue moving through the market. The 37-day median was 2 days longer than a year earlier, suggesting a modest slowdown. Buyers may have more time to compare options, though desirable homes can still move faster than the statewide median.
Closed sales softened in September. Virginia recorded 8,645 home sales, down 3.0% year over year. August closed sales were 8,985, down 4.6% from August 2025, marking the first annual decline since November 2025. Still, sales during the first eight months of 2026 were 3.6% higher than the same period in 2025. Together, these figures suggest demand hasn’t vanished; rather, recent monthly activity has cooled after earlier growth.
Pending contracts provide a closer look at buyers preparing to close. Virginia had 8,346 homes under contract in August 2026, 3.1% fewer than a year earlier. Homes spent a median of 19 days on the market that month, compared with 17 days in August 2025. This combination points to slower movement, not a complete pause. For buyers, it can mean more time to weigh condition, location, and price. Sellers may need to pay closer attention to comparable listings and buyer response.
HUD’s Comprehensive Housing Market Analysis estimates demand for sales and rental housing over a three-year forecast period, alongside the supply needed to support balanced conditions. That longer view complements monthly sales data: a single month can shift, while a three-year outlook considers broader housing needs. For Virginia buyers, the practical takeaway is to assess local selection and market pace rather than rely on statewide sales totals alone.
So, are there enough homes? Virginia’s September inventory grew, while sales and contract activity eased in recent monthly comparisons. The balance depends on where you’re looking, which homes are available, and how quickly buyers act. Track new listings, pending activity, and time on market together for a clearer read on supply and demand than any one measure can provide.
What is the housing market like right now?
Home values statewide had increased 2.1% over the past year, showing continued price growth. Yet the statewide figure doesn’t describe every local market. Compare price direction with listing activity and buyer demand in the specific area you’re considering.
Northern Virginia’s July figures show a different pace. At the same time, active listings reached 3,025, up 19.6% year over year. Supply reached 2.13 months, a 14.8% increase from July 2025. More listings can give buyers additional options, while the price decline signals that local conditions aren’t moving in lockstep with statewide growth.
Sales activity adds another layer to those trends. Northern Virginia recorded 1,582 closed sales in July 2026, down 1.9% from July 2025. New pending sales fell 7.2% year over year, while homes took an average of 21 days to sell, up 5.0%. Together, the figures suggest a market where buyers may have more room to compare, even as homes continue to sell.
Virginia’s recent history also shows why a single month needs context. Inventory levels were higher than in 2024 during most months of 2025, and home sales recorded modest growth that year. Prices were increasing in 2025, too. Read those patterns alongside 2026 data: listings have risen in Northern Virginia, while its median price and pending activity have eased year over year.
Migration can shift demand between local markets. Nationwide, 19% of homebuyers searched to move to a different metro area between April and June 2026. That figure describes searches, not completed moves into Virginia. Still, it highlights why local demand can respond to buyers comparing metros, jobs, lifestyle, and housing choices. For a Virginia search, look at the destinations buyers are considering and the inventory available there.
How might Virginia rents and the rental market change? HUD’s Virginia Comprehensive Housing Market Analysis estimates demand for sales and rental housing over a three-year forecast period. Rental conditions depend on how local housing supply meets household demand, so statewide home-sale prices alone don’t determine rent trends.
For a practical read, compare the local median price, active listings, closed sales, and pending activity across matching periods. Northern Virginia’s July 2026 figures, for example, combine rising inventory with lower year-over-year prices and fewer pending sales. That mix offers a clearer picture than any single statistic. Keep the time period and geography consistent, then assess whether local supply is expanding or tightening as buyers and renters make decisions.
Virginia metros with the fastest price growth
Virginia’s price picture depends on whether you’re comparing the state or a specific metro. Statewide, home prices were increasing in 2025. The average home value was $412,252, updated on September 30, 2026. These measures use different calculations, so compare like with like when tracking a local trend.
Active listings offer another clue about changing market pressure. Virginia had 28,560 active listings in August 2026, 13.8% more than a year earlier. A larger selection can give buyers more homes to compare, while sellers may face more competition for attention. It doesn’t establish which metro has the fastest price growth. For that, compare local prices across matching periods, then consider listing and sales activity alongside them.
Northern Virginia’s latest figures point to a different direction from statewide price growth: its median sold price declined year over year in July 2026. That distinction matters when reading a statewide forecast. A state-level increase can coexist with a local slowdown, and more available listings may affect how quickly prices rise. Use Northern Virginia’s price direction as a local signal, not a template for every Virginia metro.
How does Northern Virginia’s housing market forecast compare with Richmond, Hampton Roads, and Roanoke? The available market figures show Northern Virginia’s median price moving down year over year, while statewide prices increased. HUD’s market-analysis dates vary: Northern Virginia’s report is dated 2023, Richmond’s 2025, and Virginia Beach-Norfolk-Newport News’s 2024; Roanoke’s listed analysis dates to 1971. Those report dates describe different analysis vintages, not a current ranking of metro price growth.
To identify the fastest-growing metro, compare the same price measure over the same period in Richmond, Hampton Roads, Roanoke, and Northern Virginia. Then consider active listings and closed sales. Price growth alongside expanding inventory may signal a different market balance than rising prices amid tighter supply. Keep metro boundaries consistent, too: a city and its wider metropolitan area can show different patterns.
For your search, follow three steps: choose a specific metro, compare its price trend over matching periods, then check whether listings and sales support that direction. For example, if you’re choosing between Northern Virginia and Richmond, assess each local market separately rather than assume statewide growth applies equally. This approach distinguishes broad appreciation from local momentum and helps you focus on neighborhoods that fit your plans.
Local economic, demographic, and housing conditions
Virginia’s average home value was $412,252, updated September 30, 2026. The state averaged three months of housing supply in September. These figures set a useful starting point, but local employment, household changes, and available homes shape conditions differently across Virginia. For a neighborhood-level view, compare listings and prices with the needs of households moving into or within that area.
What are the forecasts for Virginia mortgage rates and housing affordability? Mortgage rates were expected to drift toward the low 6% range in 2026, but rose above 7% for the week ending September 18, 2026. Affordability depends on the home price, borrowing rate, available supply, and a buyer’s budget, so a statewide average cannot describe every household’s options.
HUD’s Comprehensive Housing Market Analysis reports examine economic, demographic, and housing conditions across three periods. They also estimate sales and rental demand over a three-year forecast period. These time frames help distinguish immediate market movement from longer-term housing needs. Population shifts and household formation can influence demand, while new construction and listings affect the choices available to buyers.
HUD’s Virginia report dates show why local context matters. Charlottesville’s analysis is dated 2026, Richmond’s 2025, and Virginia Beach-Norfolk-Newport News’s 2024. Northern Virginia’s report is dated 2023. These editions cover different points in time, so their dates shouldn’t be mistaken for a current ranking of market strength. Use them as market-specific context, then compare current listings and sales in the location you’re considering.
Economic conditions influence both sides of a housing decision. Job opportunities can draw households to a region, while commuting patterns and lifestyle preferences shape the communities they consider. On the supply side, construction activity and the number of homes listed affect available choices. Compare local inventory with buyer activity and household needs rather than assume statewide conditions apply equally to every metro.
What risks could affect Virginia homebuyers and sellers in 2026? Mortgage-rate movement can change borrowing costs, while rising inventory may increase competition among sellers. Virginia’s September data also showed that 17.6% of homes had price drops, compared with 15.0% a year earlier, making pricing and local comparisons especially relevant.
Build a grounded outlook by tracking three local signals: current listings, recent closed sales, and price changes over matching periods. Then consider whether a HUD analysis reflects the area and timeframe you care about. For example, Charlottesville’s 2026 report is newer than Northern Virginia’s 2023 analysis. Combining that local context with current market activity helps you assess how supply, household demand, and borrowing conditions may affect your next move.
Northern Virginia versus national market
Northern Virginia’s July 2026 market differed from the national picture in price direction and available supply. This contrast shows why national appreciation doesn’t automatically describe conditions across Northern Virginia.
Supply also favored buyers more nationally, though inventory expanded in both markets. Northern Virginia had 2.13 months of housing supply in July, up 14.8% year over year. The national market had 4.6 months of supply, unchanged from July 2025. More months of supply generally give buyers more listings to consider relative to sales pace. The regional gap suggests Northern Virginia remained tighter than the country overall.
Time on market offers another useful comparison. Northern Virginia homes averaged 21 days on the market in July 2026, up 5.0% year over year. Nationally, homes spent 29 days on the market, up 3.6%. Both markets took longer than a year earlier, but Northern Virginia homes still moved faster. That difference matters when planning how quickly to tour, evaluate, and make decisions.
Sales activity moved in opposite directions. Northern Virginia recorded 1,582 closed sales in July 2026, down 1.9% year over year. National closed sales increased 0.7% to 4.06 million. New pending sales in Northern Virginia fell 7.2%, indicating fewer homes were moving toward closing there. Closed sales measure completed transactions; pending activity can reveal a shift before closings reflect it.
For buyers, the comparison points to a more competitive regional setting than national supply alone might suggest. Northern Virginia’s 2.13 months of supply remained below the national 4.6 months, despite a year-over-year increase in local listings. A growing selection can widen your choices without creating the same negotiating conditions found in a market with more supply. Compare neighborhood-level listings and recent sales before drawing conclusions from either regional or national figures.
Pricing decisions depend on nearby comparable homes, their condition, and current competition. Buyers can look at days on market and pending activity to understand how quickly local homes are attracting interest. Keep comparisons consistent by using the same month, geography, and measure for each market.
Use these figures as a practical starting point, then narrow the comparison to the communities that fit your plans. If you’re weighing a move within Northern Virginia, explore Northern Virginia living options as you compare local housing choices with national trends.
Robert Caicedo Real Estate: Seller Representation
Robert Caicedo Real Estate helps sellers approach a sale with representation grounded in their property and local market conditions. If you’re deciding when to list or how to position your home, consider nearby competition, buyer activity, and recent price direction together. Statewide trends provide context, while local comparisons help shape a strategy for your home.
Seller Representation can guide you through the selling process, from considering market conditions to making informed decisions as your plans take shape. It’s a natural next step when you’re preparing to sell and want professional representation focused on your goals.
For a conversation about selling your home, contact Robert Caicedo Real Estate or visit mynovaliving.com.
Turn your market research into a confident next step
A Virginia housing market forecast can help frame your choices, but your next move should reflect what matters most to you. Clarify your preferred location, timing, and must-have features first. Then use those priorities to focus your search or prepare your home for sale. A clear plan keeps shifting market signals in perspective and helps you make purposeful decisions.
Choose representation that fits the decision ahead. Robert Caicedo Real Estate offers Seller Representation if you’re preparing to list, Buyer Representation as you evaluate homes, and support with New Construction Homes if a newly built residence suits your plans. A conversation can help connect your goals with a practical path forward.
Take the next step at your pace. Contact Robert Caicedo Real Estate to discuss your real estate plans and move toward a home that feels right for you.
Frequently Asked Questions
How competitive is the market?
Competition varies by location, property, and price range. Virginia’s sale-to-list price ratio was 99.1% in September 2026, indicating that sale prices overall remained close to asking prices. For a specific home, compare recent nearby sales with its condition and features. Also watch how long similar homes remain available; a regional average may not reflect the pace in your preferred neighborhood.
What are Virginia home price forecasts for the next 1 to 3 years?
Virginia’s three-year outlook depends on local demand and the balance between available homes and buyers. HUD’s housing analyses estimate demand for sales and rental housing over a three-year forecast period, but that estimate isn’t a guaranteed price path. For your plans, assess price movement in the specific area and property type you’re considering, then revisit the comparison as local supply and buyer activity change.
How are Virginia home sales, inventory, and days on market trending?
The indicators show a mixed pace rather than one simple direction. New listings rose 4.6% year over year in August 2026, while the value of home sales was approximately $5 billion, down about $125 million, or 2.5%, from a year earlier. Read days on market alongside new listings and closed sales: together, they help distinguish slower turnover from a change in the number of homes available.
Which Virginia cities and regions are expected to see the strongest home price growth?
Available comparisons don’t establish a clear price-growth leader across Virginia’s metros. Charlottesville, Richmond, Hampton Roads, Roanoke, and Northern Virginia each have distinct local conditions. For a practical comparison, track the same price measure over the same period in each market, then consider local listing and sales activity. Buyers exploring Aldie, Leesburg, Middleburg, Ashburn, Sterling, Reston, or Washington, D.C., should compare their target communities individually.
What factors could drive or weaken Virginia's housing market forecast?
Local job opportunities, household growth, new construction, and the number of homes listed can strengthen or soften demand. Borrowing conditions also affect what buyers can afford, while rising inventory can offer shoppers more options and increase competition among sellers. To assess an area, compare new listings with closed sales, then consider whether local economic and household changes are bringing more buyers into the market.
How does Virginia's housing market forecast compare with the national housing forecast?
The national market provides context, but it doesn’t predict Virginia’s local direction. National active listings totaled 1.54 million in July 2026, down 0.6% year over year. Virginia and Northern Virginia can differ from that broad trend because local prices, supply, and buyer activity vary. Compare matching periods and measures, then use national data as background rather than a substitute for local market signals.


